The most comprehensive tool for precise prospecting!
Count on us at every step of the way!


Do multichannel prospecting,
but do it right !
1.
Start on
healthy bases!
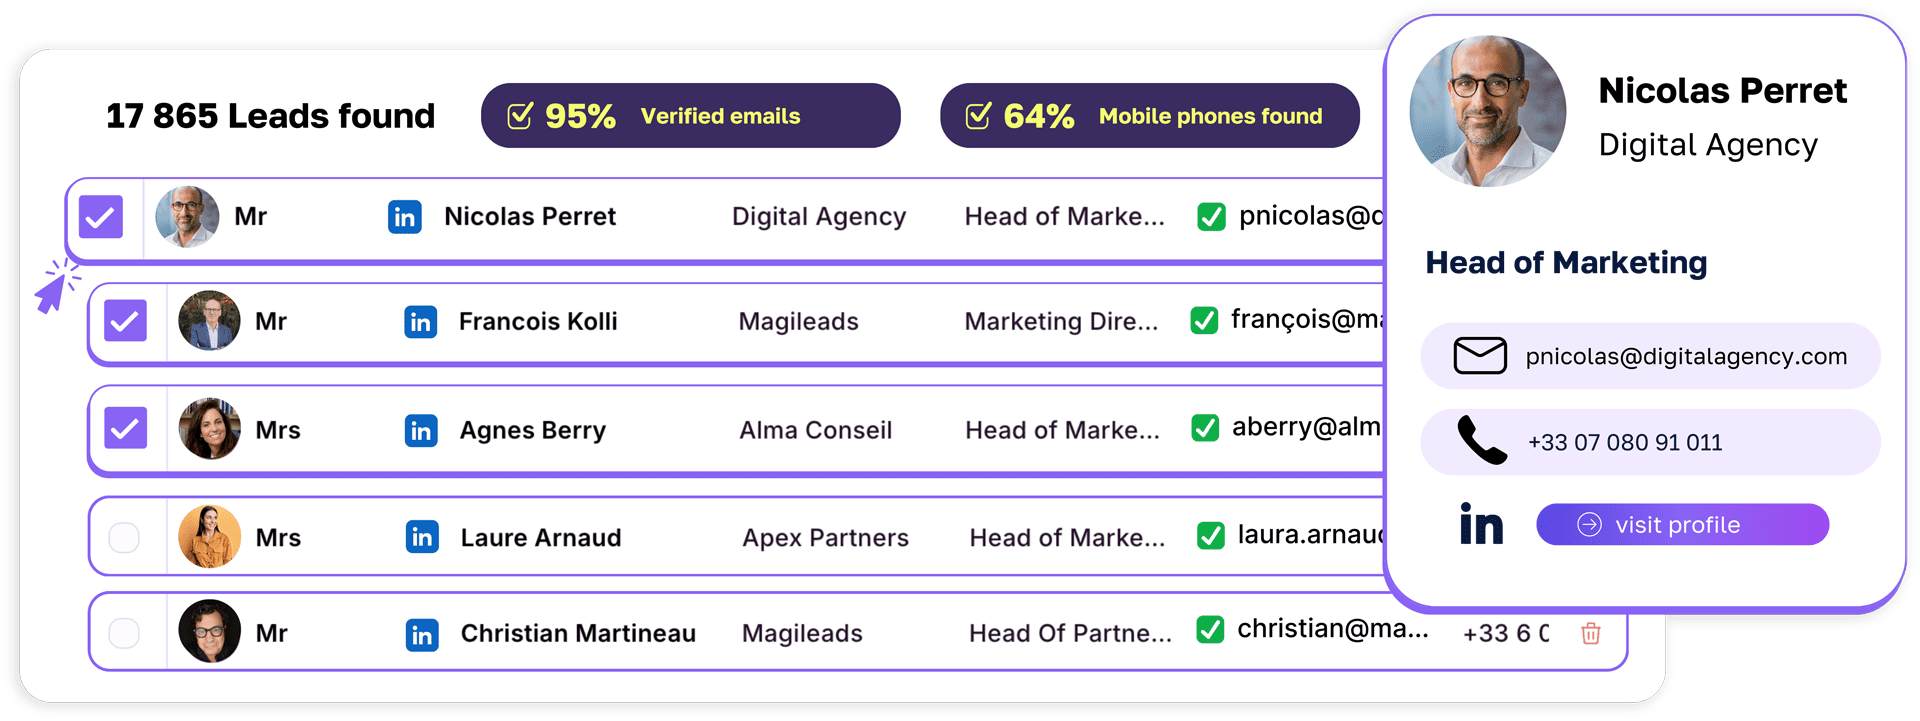
Import your prospects in real time from LinkedIn, Google Maps or use our database of thousands of contacts.

2.
Reach your
prospects
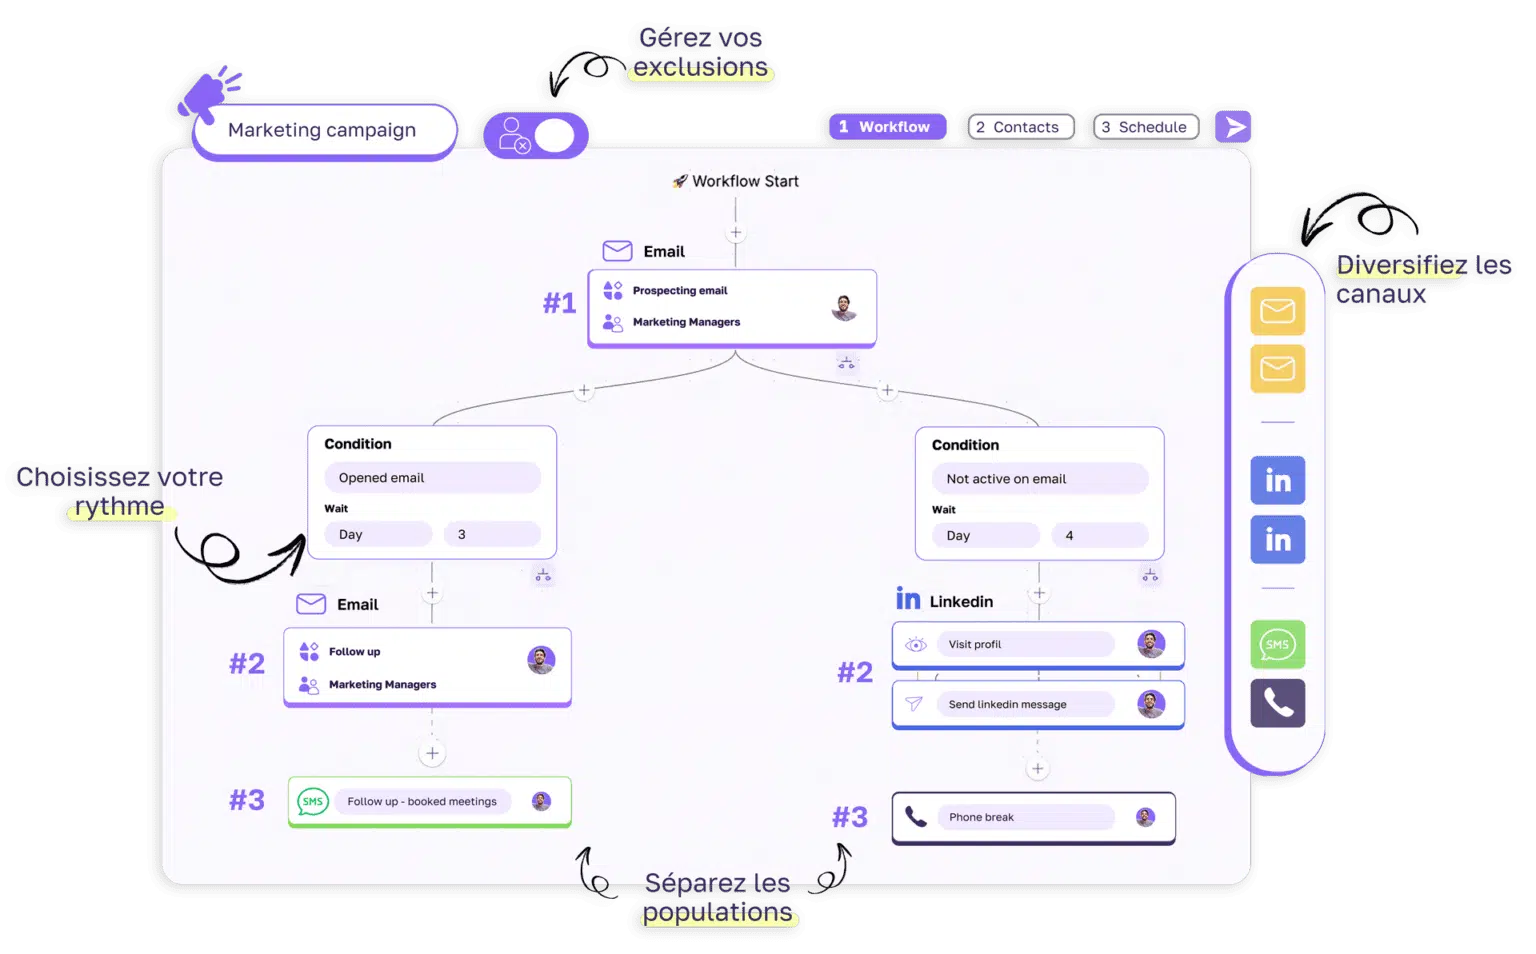
multichannel campaign scenarios by choosing the channel and the approach most suitable for your targets.

3.
Analyze, adjust.
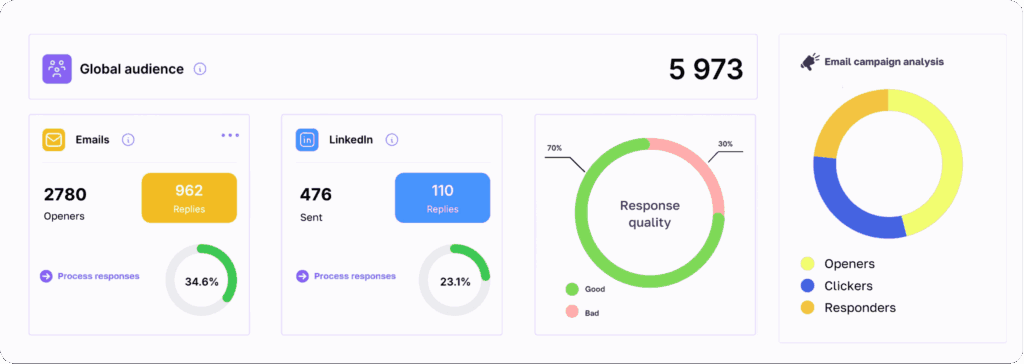
Analyze the performance of your campaigns in real time thanks to detailed dashboards.
Identify the points to optimize to adjust your actions and maximize your responses.
Delivebility reports
Campaign comparison
Performance indices

4.
Close!
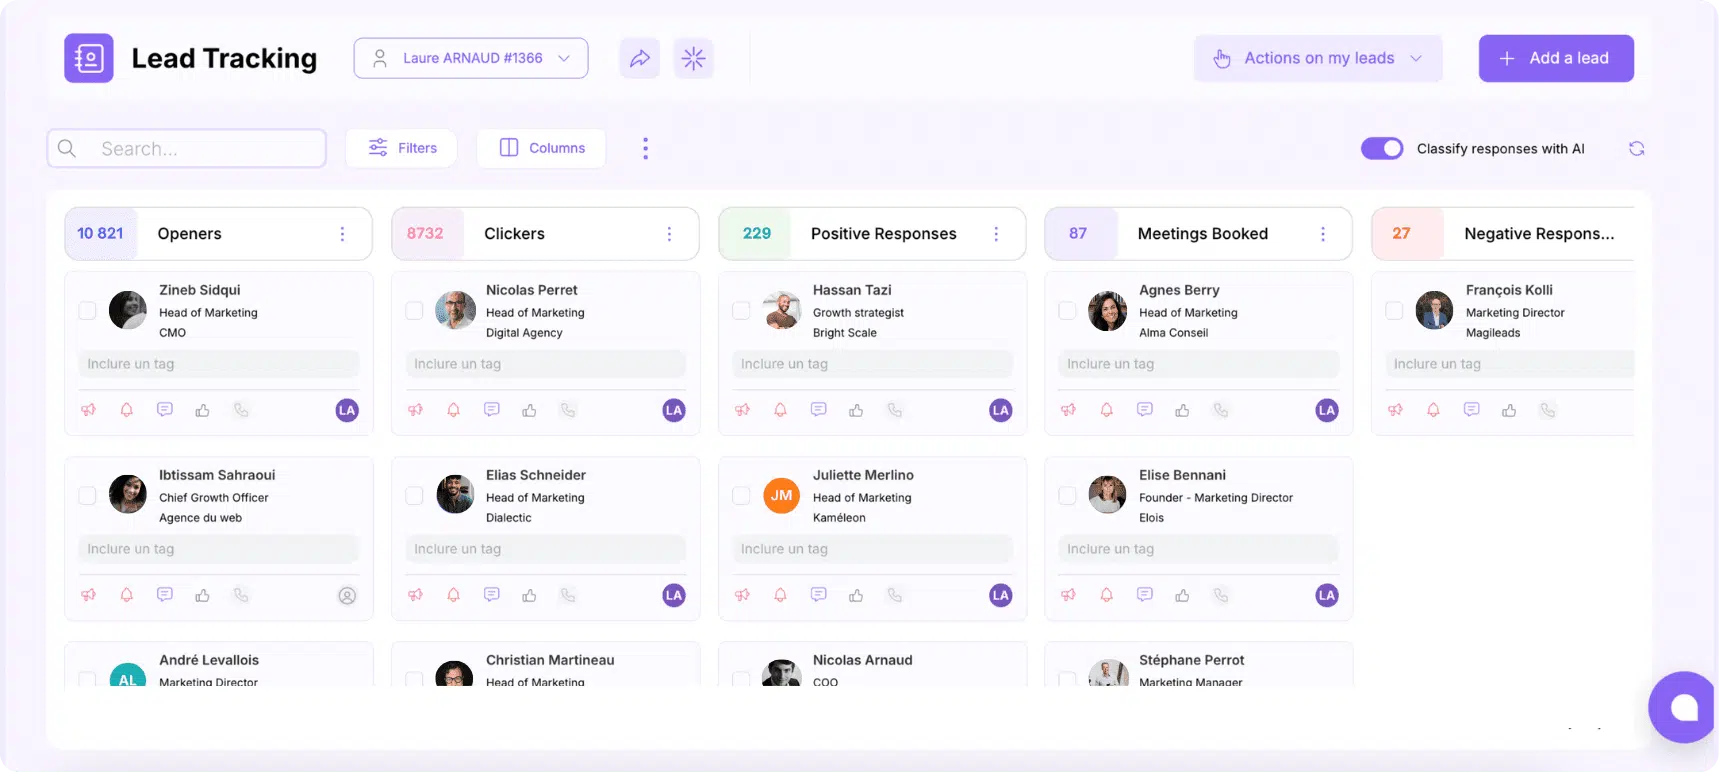
Track your leads in real-time with an organized view based on their interactions with your campaigns.
Strategically organize your actions to convert your prospects into customers more quickly.

The only platform that builds your databases in real time!

What our
15,000 users love
on Magileads
Join the Magileads community and take off your business like never before!
Our promise?
Be the most complete tool you have never tested
Magileads in
white label
Are you a digital or marketing agency? Boost your efficiency and provide your clients with a high-performance multichannel prospecting solution. Fully customizable to your branding.

Personalization
Get the platform in your colors in just 2 minutes , no technical skills required.

Centralization
Manage all your clients from a single admin space. No more headaches with multiple tools!

Scalability
Is your client portfolio growing? Add as many users as you want, with no extra costs.

Managing your campaigns as a team has never been easier!
Never lose sight of your leads.
Find all the interactions of your prospects in your dashboards, whether on your campaigns or those of your colleagues.
Share to conquer better
Assign the leads to your salespeople and keep an overview for your operational needs.
Feed your internal CRM
Magileads is compatible with all the CRMs on the market, you only need a few clicks to import everything into your own environments.
What makes Magileads much more
than just a prospecting tool

We know that every profession is unique.
On Magileads, you'll be surprised by the level of customization. Every feature is designed to adapt to your specific challenges.
“Magileads helps me to structure my processes, gain efficiency and better follow my prospects throughout their journey.”
Mathieu Nadal
Founder of the UPLEADS agency

Agility like nowhere else
Our product roadmap is fueled by your feedback. A requested feature is usually integrated within 2 weeks.

“The platform continues to improve to provide ever more precise data and offer even more extensive features.”
Anthony ARIMBELLI
Linkforce


A web platform, but not just that...
From your first steps on Magileads, you'll feel the closeness to our teams. All our expertise is at your disposal as soon as you express a need.
“Support, proximity and availability of Magileads teams are an undeniable asset in our collaboration.”
LORIS TODARO
Founder of the HUBLEAD agency

Verified contacts, targeted campaigns and converted ,
do you say?
Even our pricing is unique!
No plan A, B or C with us.
All our features are included no matter what you pay!
How do we set our prices?
It's simple: adjust your enrichment volumes and
number of accounts for a price 100% adapted to your needs!
- Unlimited emails sent
- Unlimited LinkedIn Scraping
- Imports of unlimited emails
- Unlimited warm-up
- Unlimited multichannel campaigns
- Access to the follow -up dashboards
- API access
White label
Magileads' white label is available to everyone at the same price as a standard subscription. Contact our teams to launch your project.
Expert offer
Need support for your prospecting strategy? A dedicated project manager will build your campaigns from A to Z.

Your subscription is for running successful campaigns , not for unlocking features!
They say it better than us✨

Michael Chiche
Manager and founder of Unitead
A revolutionary tool for my commercial prospecting!
As a manager and founder of Unitead, I want to salute the work accomplished by the Magileads team. This application has literally transformed my way of managing prospecting. Thanks to its innovative features, I was able to simplify my processes, save precious time, and automate tedious tasks.
Magileads allowed me to focus on the essentials: quickly get in touch with hot prospects and relevant contacts, while optimizing each stage of my commercial strategy. Today, I see a clear improvement in my results thanks to their solution. I highly recommend this tool to all entrepreneurs who seek to professionalize and speed up their prospecting actions. It is a real asset for any ambitious business!

Mathieu Nadal
founder of the UPLEADS agency
Using the platform was a real asset for managing my leads. She helps me to structure my processes, gain efficiency and better follow my prospects throughout their journey. Thanks to its intuitive features, I was able to improve the satisfaction of my customers while optimizing my time. I highly recommend this solution to all companies in search of performance.

Romain Karmann
Ceo Lota Cloud
Our ambition is to develop partner contacts in the cloud ecosystem. Magileads is a great tool for prospecting partners. Thanks to the basic construction of hyper -targeted contacts and multi -channel campaigns, the results obtained exceed our expectations. Nearly 25 meetings in less than 3 months with our future partners. In addition, Magileads allowed us to build a community of solid and captive partners

Loris Todaro
founder of the Hublead agency
Magileads is a strategic partner for any agency with multi-client issues. What we particularly appreciate:
-
The multi-fuel campaign manager allows us to generate opportunities for customers thanks to the quality of automation and the delivery it ensures.
The simplicity of use of the White Layhold allows us to be independent on the platform and to manage all of our customers.
In addition, the support, proximity and availability of Magileads teams are an undeniable asset in our collaboration. Today, it would be difficult to separate from this partner that we have integrated into the development of our society.

Benoit Guiet
Commercial Director Learnybox
Magileads allowed us to structure and optimize our commercial prospecting. Thanks to their intuitive platform, we have launched high -performance multichannel campaigns and significantly increased our number of qualified prospects.
The availability and responsiveness of the team make this collaboration incredibly fruitful. This combination of an efficient tool and a quality support makes Magileads an essential partner to accelerate our growth in Learnybox.

Michael BIA
founder of the Risk and Compliance Institute
Long -standing user of Magileads, I was able to follow the different platform development phases to become one of the most complete and powerful marketing tools on the market today.
The main asset of Magileads is the support of the teams with whom we create a real partnership relationship, aligned with our business issues. Today, I do not see myself managing my multichannel campaigns elsewhere than on Magileads.
Thank you to the teams for their availability, their expertise, and the remarkable quality of the tool.

Catherine Bernard
Lead Camp
We have been using Magileads in white label for over 2 years. This collaboration has enabled us to considerably improve the quality of our services and go from 0 to 30% loyalty.
The improvements are continuous.

Laurent Jaffres
Knight White
A strategic ally for our company Chevalier Blanc
I am Laurent JAFFRES, the founder of a social and solidarity economy company. Its mission is to improve access to justice for all. It brings lawyers guided by the values of loyalty, equity and solidarity guided, Magileads has become a major asset in our commercial acquisition strategy.
Thanks to this tool, we have not only optimized our prospecting approaches, but also benefited from lists of relevant international contacts, carefully constituted via their solution. This allowed us to establish precious connections with lawyers, lawyers and foreign partners, paving the way for concrete opportunities in new markets.

Eric Schekler
The ESR agency
An essential tool for our digital communication agency!
Eric Schekler founder of the ESR agency, specialized in digital communication, I was constantly looking for high -performance tools to optimize our strategies and support our customers in their growth. Magileads was a real revelation for our digital prospecting in white marque and our colors.
Thanks to this platform to our brand, we were able to structure our Mail and LinkedIn campaigns, identify qualified leads with formidable precision and automate time -on tasks. The integration of Magileads into our processes has not only boosted our internal efficiency, but also allowed us to obtain concrete results for our customers: an increased conversion rate and better satisfaction of our customers.
Today, Magileads is much more than a tool for us. It is a strategic partner that helps us meet the challenges of prospecting in a competitive environment. I highly recommend this solution to all agencies who wish to move up a gear in their business development!

Romain Dias
SpaceLead
Magileads is an ultra-powerful tool for customer acquisition professionals.
Through its white marque, SpaceLead has adopted a posture of authority and credibility by integrating its graphic charter and brand image directly on the tool.
This allows us to prove to our customers that we are ready to invest in the development of our company to provide them with convincing and tangible results in order to increase their growth.

Anthony Arimbelli
LinkForce
An essential tool and impeccable service!
We have been using Magileads for several years, and this platform has established itself as an essential tool in our prospecting strategy.
It offers a complete solution, combining enrichment of data, automation and monitoring of campaigns in a fluid and intuitive manner.
What distinguishes it from others is its constant evolution. The platform continues to improve to provide ever more precise data and offer even more extensive features, perfectly meeting the needs of the market. Beyond the technical wealth of the tool, it is customer support and technical service that make the real difference.
A listening, responsive and invested team, ready to quickly answer our specific questions and needs. Special mention to Nicolas, who, in addition to making clear and practical explanatory videos, always remains available to bring us his technical expertise and support us on certain technical subjects with remarkable efficiency.
Magileads is much more than a platform, it is a real trusted partner! We recommend!

Virginie Combes
Vega France
I use Magileads for the creation of automated email campaigns for a few years and I am extremely satisfied with it: the tool is very complete, intuitive, and new features are regularly implemented.
The icing on the cake, customer service is ultra responsive and is not content to assist us in using the interface, it also gives us valuable advice to optimize our campaigns. In short, I recommend a thousand times!

Jean-Luc Ratier
Marketing Manager, Talents & Projects
Following a training in Growth Hacking, I had the opportunity to discover several Cold Emailing applications, sometimes to my detriment (blocling of my LinkedIn account in particular). When I arrived at Talents & Projects, I discovered a new application, developed a few steps from our premises, Magileads. I was immediately impressed by the ease of use of it and the clarity of its dashboard of the campaign follow-up.
Subsequently, I appreciated the many features offered by Magileads (writing message thanks to the AI, data enrichment, scrapping of offers on LinkedIn or Google Maps). The application perfectly manages the sending limits without ever burning your LinkedIn account or its email addresses and allows you to make campaigns quickly and efficiently. The real plus, the availability of Nicolas and François who answer all my questions with speed and efficiency. I really recommend Magileads to all those who want a reliable tool to prospect effectively.
Frequently asked questions
What is Magileads for?
Magileads is the most complete automated prospecting platform on the market. We have optimized each feature to maximize your chances of reaching and converting your prospects.
- Generation of Magileads real -time prospects
is the only platform to offer a generation of prospects in real time, and not from a static base. In a few clicks, define your search criteria and generate thousands of qualified contacts in a few minutes. - Automated multicanal campaigns
Automatize your email, LinkedIn or SMS messages. Reduce your efforts and contact a large volume of prospects with ease. - Monitoring and optimization of campaigns
with our detailed dashboards, analyze the performance of your campaigns (opening rate, clicks, responses, etc.) and compare your campaigns between them to adjust your strategies. - customization and segmentation
allows you to reach a high level of precision in the segmentation of your prospects and the personalization of your messages, thanks to AI in particular. - Integration with your tools
The platform fits easily with your tools: CRM, HubSpot, Pipedrive, Zapier, Make, and many others, to centralize and optimize your processes. - AI in Magileads
The artificial intelligence of Magileads transforms the way you prospect. It helps you achieve unequaled precision in your prospecting campaigns. - Powerful Magileads API
offers a robust API library, allowing you to integrate its features directly into your systems and automate your prospecting workflows.
Unique Blanche Marque on the
Magileads market is the only platform to offer a white label offer. You can customize the platform with your colors and your brand in a few clicks, for a completely solution to your image.
Is your solution developed and hosted in France?
Yes, our solution is 100 % French:
- It is developed in France.
- It is hosted on secure servers located in France, supplied by OVH.
- All data from Magileads and our customers are stored on secure servers in France.
Is my information safe?
Yes, our solution is 100 % French:
- It is developed in France.
- It is hosted on secure servers located in France, supplied by OVH.
- All data from Magileads and our customers are stored on secure servers in France.
Is there a commitment during a subscription?
No, there is no commitment. You can unsubscribe at any time. Your account will remain active in Freemium mode, and you can reactivate your subscription at any time if you wish.
What do I have access to during the trial period?
During the trial period, you have access to all of the platform features, including:
- 250 Email enrichment and telephone
- 1 connected shipping email account
- 1 connected LinkedIn account
No bank card imprint is required.
Can I request training or support on the platform?
Yes, we offer several support options adapted to your needs. You can choose to be trained at the platform to then use it in total autonomy. If you prefer a more complete support, a dedicated project manager will support your prospecting on the platform from A to Z.
We are here to help you maximize the impact of your campaigns and guarantee your success.
Can I ask for a demo before subscribing?
Yes, we offer personalized demos to allow you to discover all the features of Magileads before subscribing. Contact us to plan your demo!
